Real-time. Streamlined. Actionable.
Instant Insights for Smarter Decisions
Stay ahead of the curve with real-time insights that drive smarter decisions. Kahua Analytics empowers you to unlock the full potential of your project data, keeping your team informed and agile in responding to challenges.
Construction Data Analytics Software
Data-Driven Decisions Made Simple
Optimize performance with a powerful, intuitive construction analytics platform that transforms your project data into clear, actionable insights.
Enhanced Decision-making
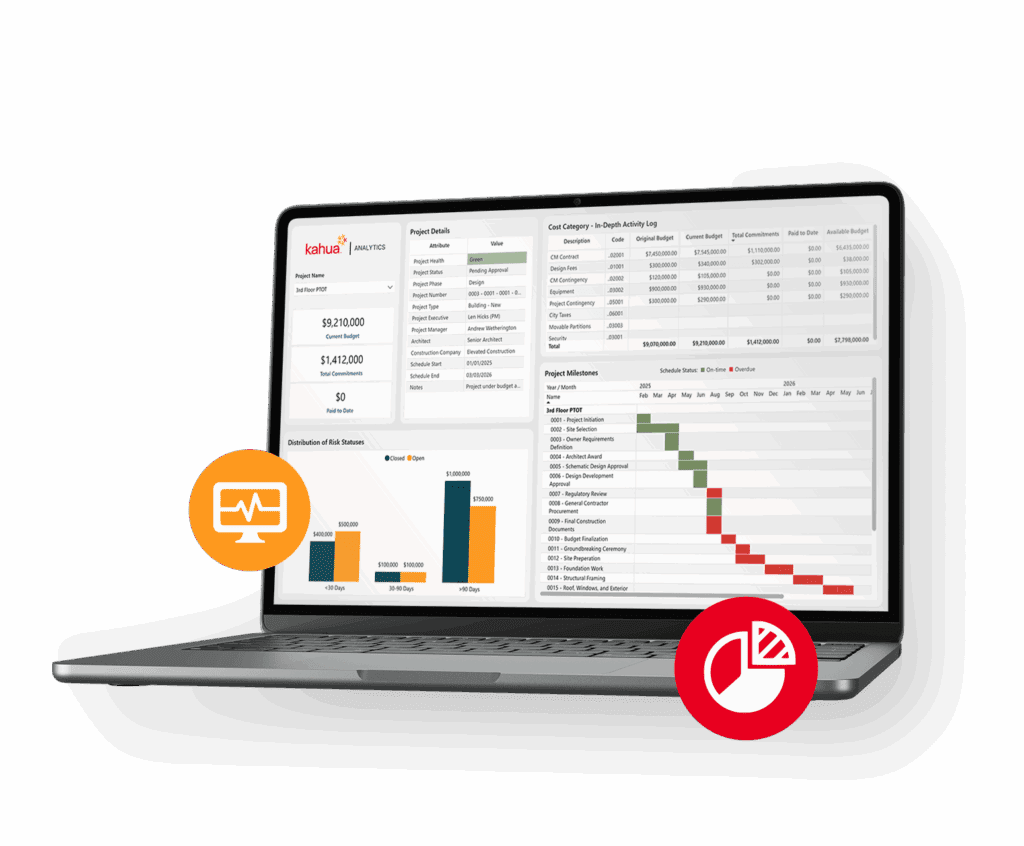
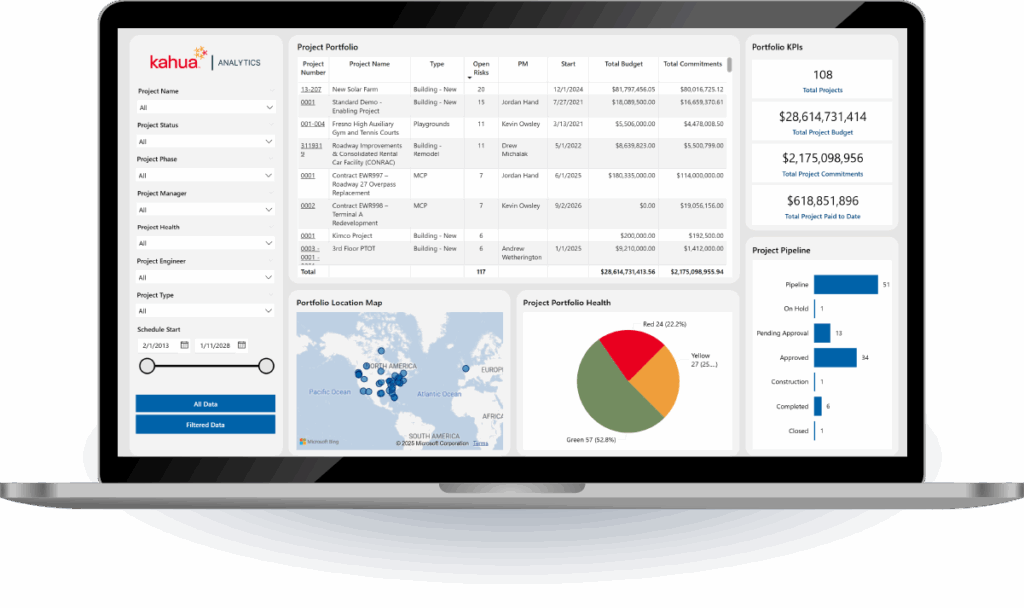
Kahua Analytics provides a holistic view of project portfolios, allowing users to track vital project data such as project health, financials, milestones, risks and approvals for smart decisions.
Risk Management and Mitigation
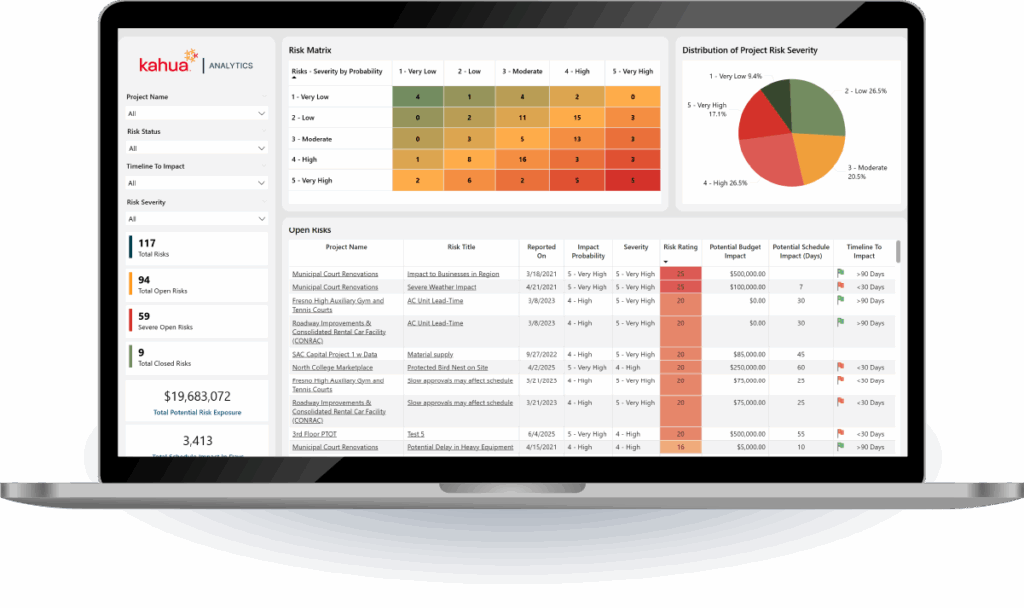
Identify and assess project risks and severity, associate cost and schedule impacts with the identified risks – then evaluate mitigation plans to proactively resolve them.
Configurable Dashboards
Access interactive dashboards for multi-level filtering and drilled-down capabilities for high-level insights and granular reports to enhance information gathering and collaborative data sharing.
Real-time project data synchronization across multiple systems allows users to investigate issues, review financials and monitor key metrics from a single source of truth without navigating separate systems.
Power BI Construction Software
Improve Construction Data Analytics & Insights
Kahua’s built-in analytics, powered by Microsoft Power BI, gives you the ability to access data effectively with powerful dashboards readily available both out-of-the-box and with flexible configurations for your business needs.
Construction Risk Management Dashboard
Avoid Risk with Real-Time Visibility
Identify potential risk impact quickly and call out potential exposures in terms of days and money. See a listing of these risks in terms of probabilities and severities – utilize the out-of-the-box scale or configure a range that fits your business process.
All Approvals Dashboard
Manage Approvals Efficiently
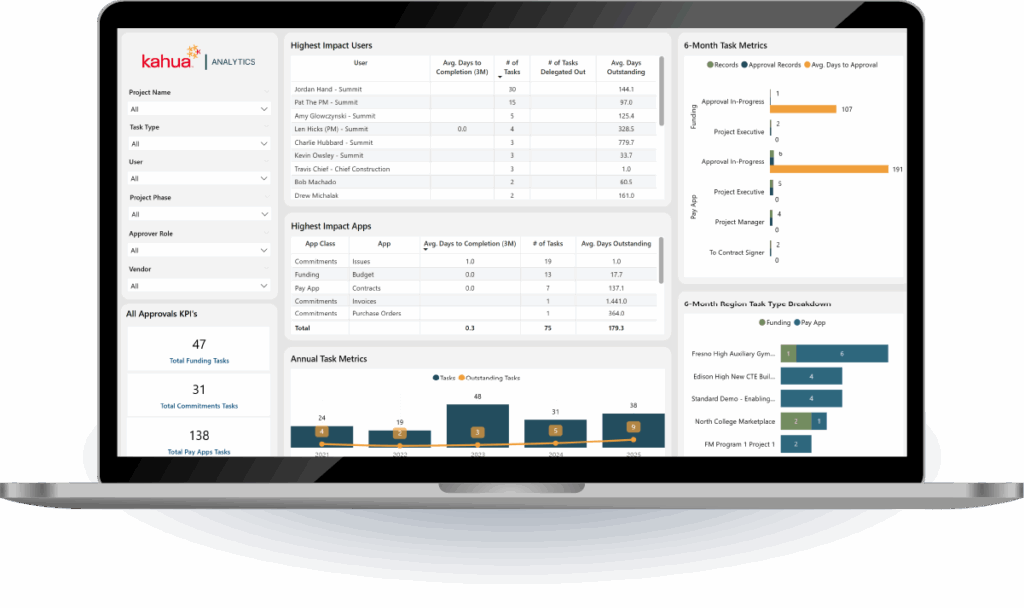
Leveraging Kahua’s workflow management system, get a quick view of what your team’s project executives are spending most of their time reviewing. Pinpoint and catch records that are disrupting final sign-off for project completion.
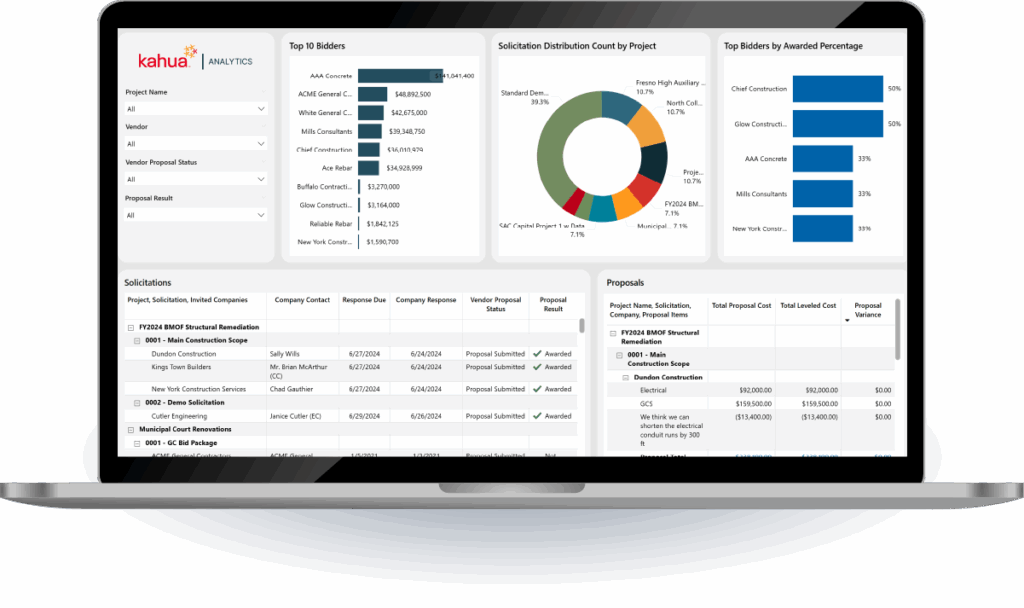
Bid Management Dashboard
Route Bid Solicitations and Proposals
Provide an overview of all bid solicitations, showing response times, who is bidding, and the dollar values of bids. It ensures comprehensive coverage of bids and allows users to monitor the bidding process effectively.
What Our Customers Say About Kahua Analytics
FAQs
Kahua Analytics is powered by the Kahua datastore, which is Kahua’s own data warehousing solution for storing all reportable data points in efficient, relational SQL Server databases. The reporting engine behind Kahua Analytics is a customized version of Power BI Report Server.
Yes, Kahua's customized version of Power BI enables customers and partners to bring their already built reports, templates, dashboards and data models. Customers and partners are encouraged to connect with our team to explore the best path forward for recreating their specific dashboards.
We have out-of-the-box and vertical-specific dashboards that run on pre-built, scalable data models to create a strong reporting basis.
Third-party data can be analyzed using Kahua Analytics through the use of Kahua-centric integrations and data migrations. Kahua Analytics is designed to visualize data stored within the Kahua platform. This means that third-party data sources can be brought in to leverage the full benefits of the hierarchical, scalable, and relational structure of Kahua.
Upon successful completion of Kahua’s Analytics Builder certification course, as well as training provided by Kahua’s Data Science team, customers and partners are equipped to build custom Kahua Analytics dashboards and deploy them to their own domains.
With Kahua's Analytics-as-a-Service, our Data Science team provides creation, enhancement, and maintenance of Kahua Analytics dashboards, as well as training.
We do not offer services that make inferences or recommendations based on the data.